Howdy, Stranger!
It looks like you're new here. If you want to get involved, click one of these buttons!
Quick Links
Feedback on a small GDS geometry-to-contour review experiment

Hi everyone,
I have been working on a small personal project called GeoSignal Preview and would like to get some feedback from people who regularly work with GDS layouts.
The basic flow is:
- Find width and space candidates using geometry-based checks
- Select a small number of regions of interest
- Rasterize each selected region
- Calculate a simplified Abbe-style aerial image
- Overlay contours at several intensity thresholds
The image below shows the kind of review output I am currently trying to organize.
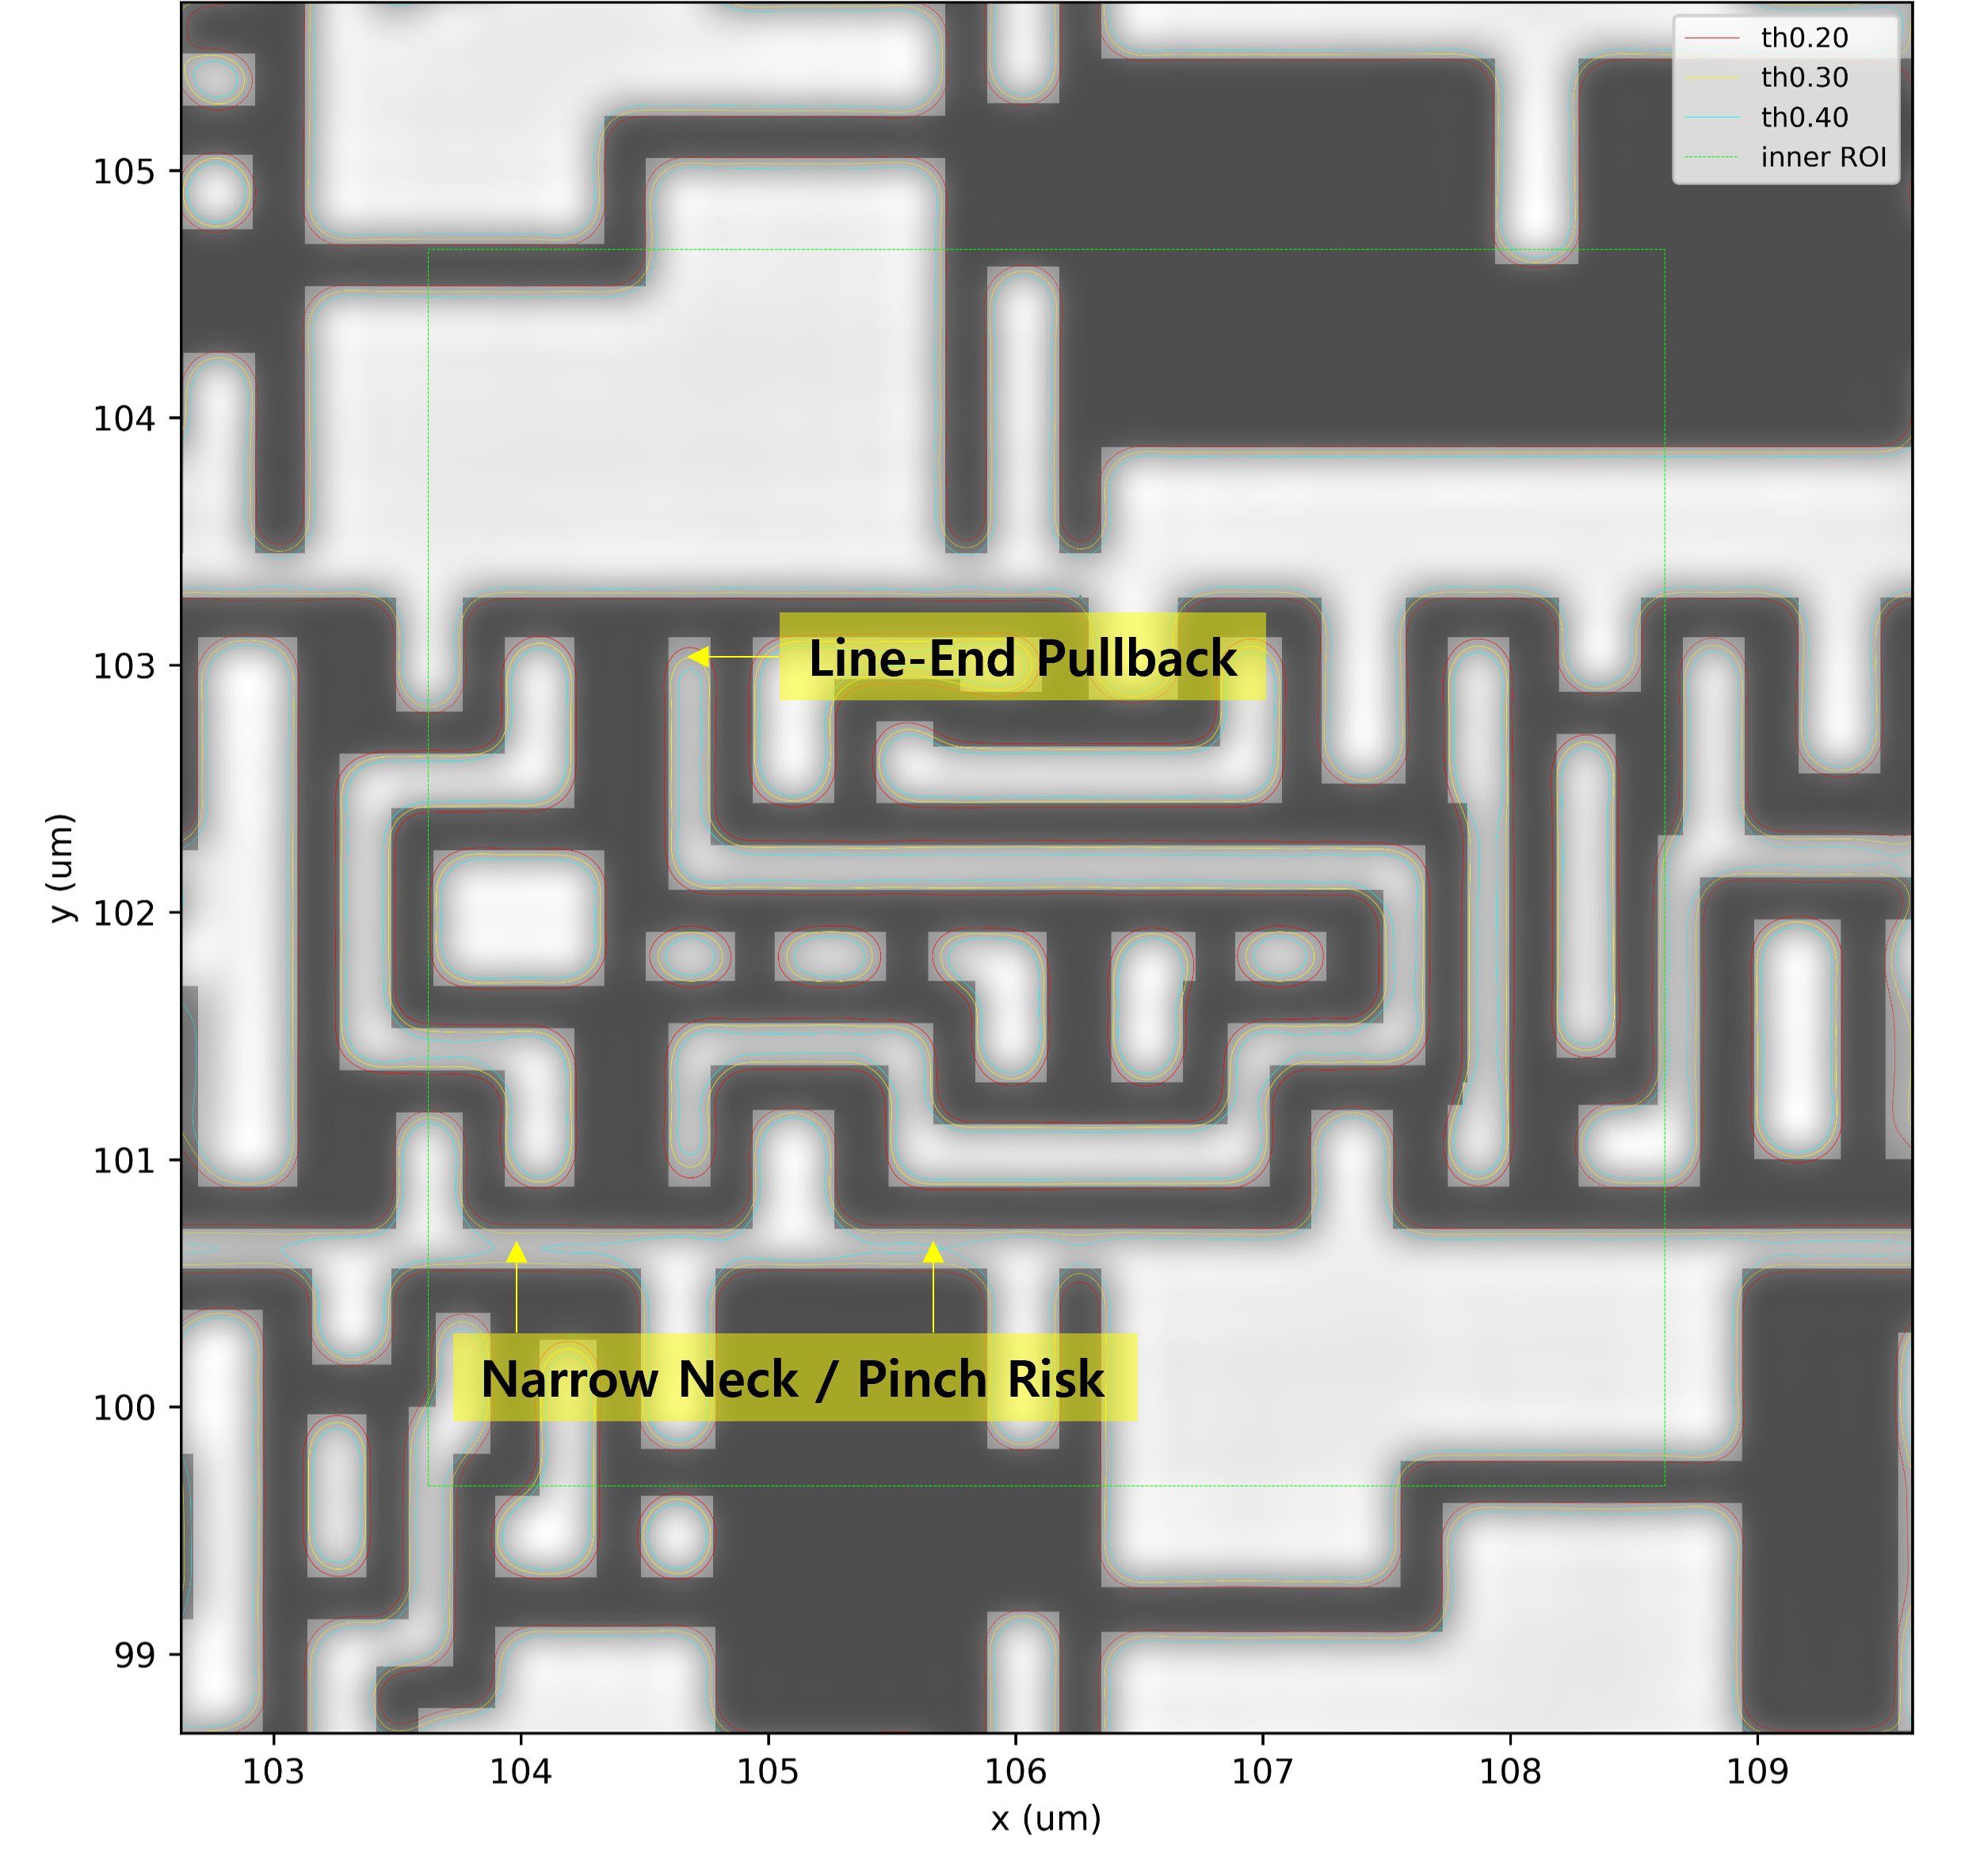
The goal is not to build a production lithography simulator. The optical model is simplified, and the results are intended mainly for qualitative review of pattern changes such as narrowing, bridging, corner rounding, or line-end pullback.
The examples use public or synthetic layouts. The core implementation code is not included in the public repository at this stage.
I put together a small project page with the overview, demo results, method notes, GitHub repository, and feedback form linked from there:
https://sjsdad.github.io/GeoSignal-preview/
I would especially appreciate opinions on these three points:
Does geometry-based filtering followed by ROI-level image and contour review seem like a useful way to narrow down regions for further inspection?
For use with KLayout, which output would be more practical: contour polygons written to a separate GDS layer, markers in a KLayout report database, or static review images?
For the next step, would it be more useful to improve the candidate-selection method, the optical calculation, or quantitative contour measurements?
Comments in this thread would be very helpful.
Comments
Hi @SJsDad,
thanks for coming to us for feedback.
Your project isn't an Open Source project, right? I could not find sources, so I can't really assess the validity of your approach.
Aerial image is good enough for higher k1 values, but not in the low k1 regime that you find in maybe 130nm and below. In that regime you will need a resist model as well.
Also, there are multiple resolution enhancement techniques in place like OPC, phase shift masks or assist features, which improve the process window. Aerial image from the original drawn layout will then not reflect the real process window, so your assessment is not valid. In order to properly assess critical structures, you need to consider the whole data preparation process. For example, a situation may become critical is a certain pitch regime, when no scatter bars can be placed between lines and side lobe printing may occur. These are real effects.
Also, for 28nm and below, usually double patterning is employed on critical layers, which fundamentally changes the boundary conditions of such an assessment.
I recall attempts were made to assess criticality based on intensity gradients which translate into a mask error enhancement factor (MEEF). But I am not really familiar with these types of analysis.
Bottom line is that it is likely possible to identify critical situations based on geometrical properties, but I think the approach isn't as easy as a simple width/space evaluation. Pattern classification by AI comes to mind, but as hot spot detection is the holy grail of lithography yield enhancement, all the big vendors have their claims there already.
Regarding question 2. and 3. I think the solution depends on the kind of analysis you want to do. Typically, the figure of merit is deviation from target, so contour polygons may be a good basis for an analysis. However, depending on your implementation of the Aerial image simulator, these figures may be easier to derive directly from the simulator.
Matthias
Hi @Matthias,
thank you very much for the detailed feedback. This is very helpful.
I agree with your point about advanced-node lithography. GeoSignal Preview is not intended to replace a calibrated lithography simulator, and it does not include a resist model, OPC/RET, assist features, phase-shift masks, double patterning, or the full data preparation flow. So I agree that it should not be interpreted as real process-window prediction.
The scope I had in mind is somewhat different. I am not trying to address vendor-grade hotspot detection for advanced nodes. I am trying to explore whether a lightweight, qualitative lithography-aware review flow could be useful for users who do not have access to a full commercial RET/OPC or calibrated simulation environment.
For example, instead of only looking at the drawn geometry, the idea is to first reduce the search space with simple geometry-based width/space filtering, and then review those selected regions with a simplified image/contour view. Even if this is not highly accurate, it may still be useful if it can highlight hotspot-like or patterning-weak candidates and reduce the number of regions that need manual inspection.
So when I used the term “hotspot-like”, I did not mean actual hotspot prediction in the full lithography sense. I meant something closer to “weak-pattern candidate for further review”. I should probably make that distinction clearer in the project description.
One of the reasons I posted here is also to check whether this kind of lightweight review flow is actually useful to anyone, or whether existing low-cost or commercial tools already cover this need well enough. If the need is not really there, then I may simply keep this as a personal study project and use it to learn more about related tools and methods.
Your point about target deviation is very useful. For the next step, I think it would make sense to focus more on reviewable outputs and simple metrics, such as contour polygons on a separate GDS layer, KLayout report database markers, or deviation-style measurements against the drawn target geometry.
Thanks again for the careful explanation. I will revise the project description to make the intended scope clearer: not advanced-node process prediction, but a lightweight qualitative review experiment for early-stage or limited-resource review environments.